17/02/2025 15:52
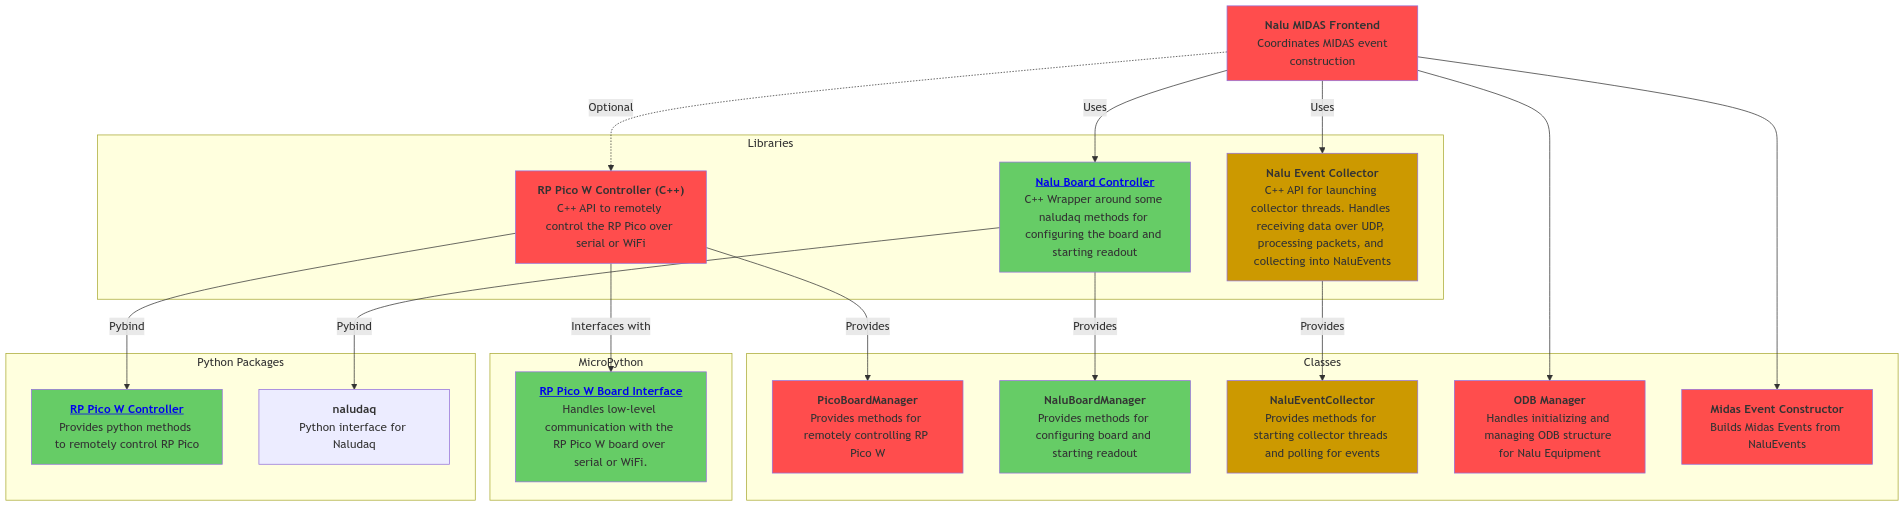
First draft of a mermaid chart for Nalu Readout System
graph TD;
    A["<b>Nalu MIDAS Frontend</b><br> Coordinates MIDAS event construction"]
    style A fill:#ff4d4d

    subgraph Libraries
        B["<b><a href='https://github.com/jaca230/nalu_board_controller'>Nalu Board Controller</a></b><br>C++ Wrapper around some naludaq methods for configuring the board and starting readout"]
        style B fill:#66cc66
        C["<b>Nalu Event Collector</b><br>C++ API for launching collector threads. Handles receiving data over UDP, processing packets, and collecting into NaluEvents"]
        style C fill:#cc9900
        D["<b>RP Pico W Controller (C++)</b><br>C++ API to remotely control the RP Pico over serial or WiFi"]
        style D fill:#ff4d4d
    end

    subgraph MicroPython
        RPBoard["<b><a href='https://github.com/jaca230/RP_pico_W_board_interface'>RP Pico W Board Interface</a></b><br>Handles low-level communication with the RP Pico W board over serial or WiFi."]
        style RPBoard fill:#66cc66
    end

    subgraph Python Packages
        P3["<b><a href='https://github.com/jaca230/RP_pico_W_board_remote_controller'>RP Pico W Controller</a></b><br>Provides python methods to remotely control RP Pico "]
        style P3 fill:#66cc66
        P2["<b>naludaq</b><br>Python interface for Naludaq"]
    end

    subgraph Classes
        Z["<b>PicoBoardManager</b><br>Provides methods for remotely controlling RP Pico W"]
        style Z fill:#ff4d4d
        X["<b>NaluBoardManager</b><br>Provides methods for configuring board and starting readout"]
        style X fill:#66cc66
        Y["<b>NaluEventCollector</b><br>Provides methods for starting collector threads and polling for events"]
        style Y fill:#cc9900
        ODB["<b>ODB Manager</b><br>Handles initializing and managing ODB structure for Nalu Equipment"]
        style ODB fill:#ff4d4d
        MEC["<b>Midas Event Constructor</b><br>Builds Midas Events from NaluEvents"]
        style MEC fill:#ff4d4d
    end

    A -->|Uses| B
    A -->|Uses| C
    A -.->|Optional| D
    B -->|Provides| X
    C -->|Provides| Y
    A --> ODB
    A --> MEC

    %% Connect libraries to the PythonPackages layer
    B -->|Pybind| P2

    %% Connect RP Pico W Controller to the MicroPython layer
    D -->|Interfaces with| RPBoard
    D -->|Pybind| P3
    D -->|Provides| Z
17/02/2025 16:45
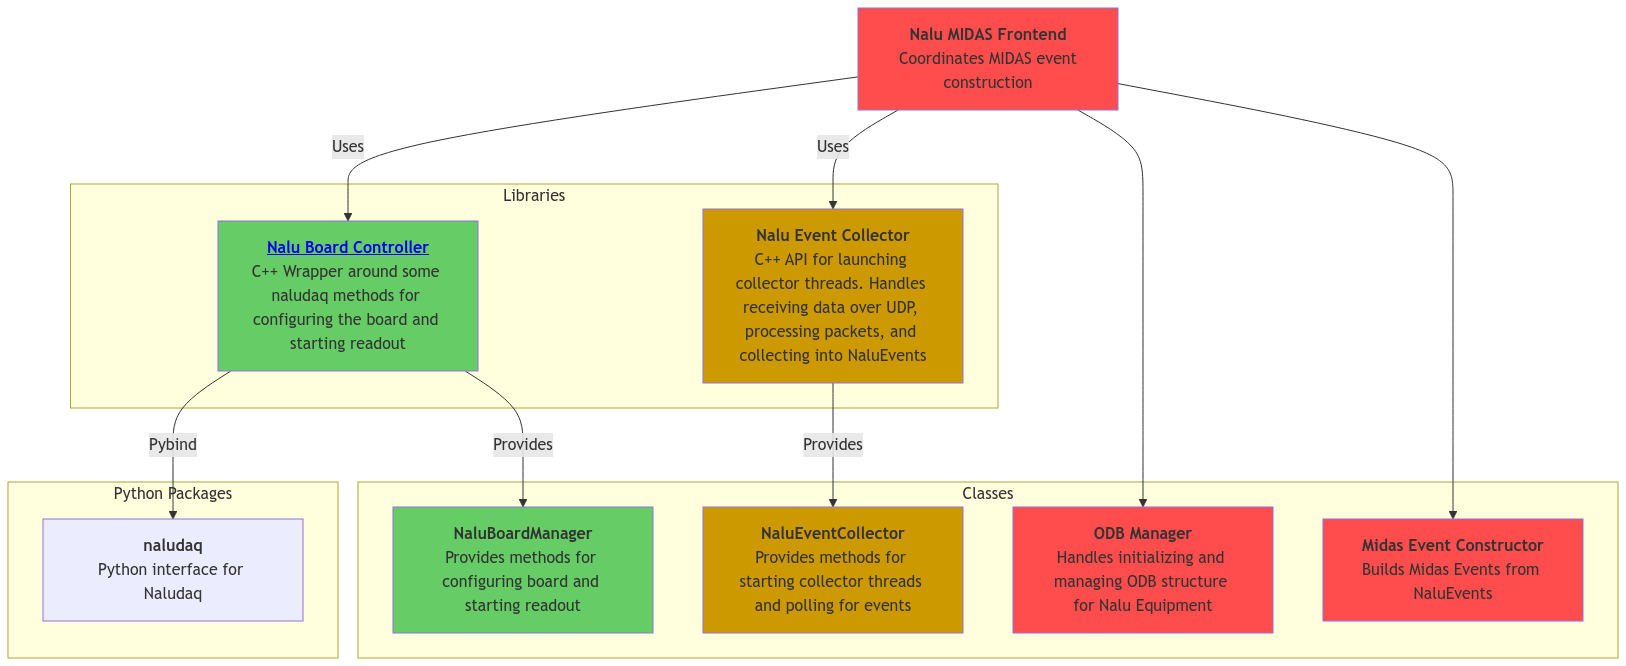
Here's the "simplified version", i.e. the branch withouth the RP Pico
graph TD;
    A["<b>Nalu MIDAS Frontend</b><br> Coordinates MIDAS event construction"]
    style A fill:#ff4d4d

    subgraph Libraries
        B["<b><a href='https://github.com/jaca230/nalu_board_controller'>Nalu Board Controller</a></b><br>C++ Wrapper around some naludaq methods for configuring the board and starting readout"]
        style B fill:#66cc66
        C["<b>Nalu Event Collector</b><br>C++ API for launching collector threads. Handles receiving data over UDP, processing packets, and collecting into NaluEvents"]
        style C fill:#cc9900
    end

    subgraph Python Packages
        P2["<b>naludaq</b><br>Python interface for Naludaq"]
    end

    subgraph Classes
        X["<b>NaluBoardManager</b><br>Provides methods for configuring board and starting readout"]
        style X fill:#66cc66
        Y["<b>NaluEventCollector</b><br>Provides methods for starting collector threads and polling for events"]
        style Y fill:#cc9900
        ODB["<b>ODB Manager</b><br>Handles initializing and managing ODB structure for Nalu Equipment"]
        style ODB fill:#ff4d4d
        MEC["<b>Midas Event Constructor</b><br>Builds Midas Events from NaluEvents"]
        style MEC fill:#ff4d4d
    end

    A -->|Uses| B
    A -->|Uses| C
    B -->|Provides| X
    C -->|Provides| Y
    A --> ODB
    A --> MEC

    %% Connect libraries to the PythonPackages layer
    B -->|Pybind| P2
17/02/2025 20:11
Sometimes, duplicate packets happen, which get grouped as their own event:
For example:
--- Standard Event Collection ---
Collected events: 272
Time taken to collect events (standard mode): 0.00371872 seconds
Mode packet count: 62 packets per event

Sample Correct Events:
Event 270 (62 packets): Packet 0 { Ch: 0, Time: 15765671, Logical: 0, Physical: 7, Index: 16679, Samples: [ Samples: [ 1500, 1518, 1519, 1531, 1497, 1516, 1503, 1496, 1514, 1530, 1489, 1514, 1504, 1490, 1494, 1476, 1486, 1516, 1528, 1517, 1488, 1468, 1521, 1516, 1513, 1496, 1540, 1513, 1522, 1517, 1512, 1539 ], Footer: [ 250, 90 ] } Packet 1 { Ch: 0, Time: 15765671, Logical: 0, Physical: 8, Index: 16680, Samples: [ Samples: [ 1528, 1496, 1466, 1516, 1522, 1498, 1486, 1502, 1488, 1504, 1493, 1493, 1512, 1522, 1512, 1516, 1520, 1516, 1505, 1507, 1474, 1507, 1467, 1490, 1464, 1487, 1518, 1534, 1488, 1517, 1568, 1496 ], Footer: [ 250, 90 ] } Packet 2 { Ch: 0, Time: 15765671, Logical: 0, Physical: 9, Index: 16681, Samples: [ Samples: [ 1510, 1480, 1526, 1525, 1484, 1504, 1490, 1506, 1506, 1535, 1544, 1511, 1483, 1507, 1462, 1509, 1518, 1534, 1484, 1490, 1490, 1475, 1496, 1516, 1519, 1540, 1538, 1517, 1502, 1509, 1540, 1566 ], Footer: [ 250, 90 ] } Packet 3 { Ch: 0, Time: 15765671, Logical: 0, Physical: 10, Index:  ... [truncated]

Event 269 (62 packets): Packet 0 { Ch: 0, Time: 15755341, Logical: 0, Physical: 31, Index: 16617, Samples: [ Samples: [ 1514, 1498, 1536, 1567, 1483, 1516, 1500, 1494, 1502, 1510, 1531, 1490, 1487, 1488, 1504, 1516, 1517, 1520, 1543, 1535, 1514, 1536, 1506, 1489, 1516, 1518, 1536, 1498, 1526, 1522, 1513, 1538 ], Footer: [ 250, 90 ] } Packet 1 { Ch: 0, Time: 15755341, Logical: 0, Physical: 32, Index: 16618, Samples: [ Samples: [ 1514, 1486, 1476, 1516, 1497, 1494, 1490, 1486, 1513, 1522, 1475, 1489, 1475, 1541, 1490, 1484, 1530, 1542, 1518, 1490, 1513, 1517, 1500, 1495, 1538, 1513, 1488, 1514, 1502, 1516, 1542, 1538 ], Footer: [ 250, 90 ] } Packet 2 { Ch: 0, Time: 15755341, Logical: 0, Physical: 33, Index: 16619, Samples: [ Samples: [ 1491, 1506, 1488, 1513, 1488, 1514, 1515, 1518, 1499, 1506, 1543, 1512, 1453, 1508, 1496, 1511, 1499, 1490, 1498, 1502, 1486, 1490, 1514, 1514, 1514, 1493, 1508, 1469, 1504, 1516, 1508, 1566 ], Footer: [ 250, 90 ] } Packet 3 { Ch: 0, Time: 15755341, Logical: 0, Physical: 34, Inde ... [truncated]

Event 268 (62 packets): Packet 0 { Ch: 0, Time: 15745011, Logical: 0, Physical: 55, Index: 16555, Samples: [ Samples: [ 1460, 1529, 1490, 1531, 1526, 1527, 1519, 1525, 1510, 1517, 1532, 1516, 1523, 1484, 1504, 1489, 1518, 1488, 1520, 1495, 1491, 1490, 1538, 1532, 1530, 1519, 1525, 1492, 1496, 1517, 1491, 1539 ], Footer: [ 250, 90 ] } Packet 1 { Ch: 0, Time: 15745011, Logical: 0, Physical: 56, Index: 16556, Samples: [ Samples: [ 1525, 1502, 1456, 1516, 1503, 1512, 1494, 1494, 1500, 1488, 1494, 1511, 1500, 1504, 1483, 1486, 1495, 1521, 1508, 1495, 1510, 1508, 1513, 1472, 1490, 1516, 1500, 1512, 1502, 1513, 1518, 1496 ], Footer: [ 250, 90 ] } Packet 2 { Ch: 0, Time: 15745011, Logical: 0, Physical: 57, Index: 16557, Samples: [ Samples: [ 1516, 1506, 1538, 1534, 1484, 1518, 1520, 1486, 1519, 1519, 1527, 1481, 1494, 1512, 1533, 1516, 1532, 1564, 1536, 1513, 1518, 1516, 1514, 1480, 1520, 1514, 1514, 1455, 1484, 1520, 1496, 1520 ], Footer: [ 250, 90 ] } Packet 3 { Ch: 0, Time: 15745011, Logical: 0, Physical: 58, Inde ... [truncated]


Sample Incorrect Events:
Event 271 (1 packets): Packet 0 { Ch: 0, Time: 15776001, Logical: 0, Physical: 45, Index: 16741, Samples: [ Samples: [ 1543, 1515, 1496, 1526, 1530, 1522, 1512, 1520, 1524, 1525, 1506, 1516, 1497, 1493, 1483, 1488, 1516, 1533, 1519, 1488, 1511, 1487, 1512, 1518, 1516, 1489, 1524, 1467, 1472, 1491, 1480, 1521 ], Footer: [ 250, 90 ] }

Event 135 (1 packets): Packet 0 { Ch: 0, Time: 15776001, Logical: 0, Physical: 45, Index: 8370, Samples: [ Samples: [ 1543, 1515, 1496, 1526, 1530, 1522, 1512, 1520, 1524, 1525, 1506, 1516, 1497, 1493, 1483, 1488, 1516, 1533, 1519, 1488, 1511, 1487, 1512, 1518, 1516, 1489, 1524, 1467, 1472, 1491, 1480, 1521 ], Footer: [ 250, 90 ] }


Total Correct Events: 270 (99.2647%)
Total Incorrect Events: 2 (0.735294%)

--- Lazy Mode Event Collection ---
Collected events: 272
Time taken to collect events (lazy mode): 0.00137712 seconds
Mode packet count: 62 packets per event

Sample Correct Events:
Event 271 (62 packets): Packet 0 { Ch: 0, Time: 15765671, Logical: 0, Physical: 7, Index: 16679, Samples: [ Samples: [ 1500, 1518, 1519, 1531, 1497, 1516, 1503, 1496, 1514, 1530, 1489, 1514, 1504, 1490, 1494, 1476, 1486, 1516, 1528, 1517, 1488, 1468, 1521, 1516, 1513, 1496, 1540, 1513, 1522, 1517, 1512, 1539 ], Footer: [ 250, 90 ] } Packet 1 { Ch: 0, Time: 15765671, Logical: 0, Physical: 8, Index: 16680, Samples: [ Samples: [ 1528, 1496, 1466, 1516, 1522, 1498, 1486, 1502, 1488, 1504, 1493, 1493, 1512, 1522, 1512, 1516, 1520, 1516, 1505, 1507, 1474, 1507, 1467, 1490, 1464, 1487, 1518, 1534, 1488, 1517, 1568, 1496 ], Footer: [ 250, 90 ] } Packet 2 { Ch: 0, Time: 15765671, Logical: 0, Physical: 9, Index: 16681, Samples: [ Samples: [ 1510, 1480, 1526, 1525, 1484, 1504, 1490, 1506, 1506, 1535, 1544, 1511, 1483, 1507, 1462, 1509, 1518, 1534, 1484, 1490, 1490, 1475, 1496, 1516, 1519, 1540, 1538, 1517, 1502, 1509, 1540, 1566 ], Footer: [ 250, 90 ] } Packet 3 { Ch: 0, Time: 15765671, Logical: 0, Physical: 10, Index:  ... [truncated]

Event 270 (62 packets): Packet 0 { Ch: 0, Time: 15755341, Logical: 0, Physical: 31, Index: 16617, Samples: [ Samples: [ 1514, 1498, 1536, 1567, 1483, 1516, 1500, 1494, 1502, 1510, 1531, 1490, 1487, 1488, 1504, 1516, 1517, 1520, 1543, 1535, 1514, 1536, 1506, 1489, 1516, 1518, 1536, 1498, 1526, 1522, 1513, 1538 ], Footer: [ 250, 90 ] } Packet 1 { Ch: 0, Time: 15755341, Logical: 0, Physical: 32, Index: 16618, Samples: [ Samples: [ 1514, 1486, 1476, 1516, 1497, 1494, 1490, 1486, 1513, 1522, 1475, 1489, 1475, 1541, 1490, 1484, 1530, 1542, 1518, 1490, 1513, 1517, 1500, 1495, 1538, 1513, 1488, 1514, 1502, 1516, 1542, 1538 ], Footer: [ 250, 90 ] } Packet 2 { Ch: 0, Time: 15755341, Logical: 0, Physical: 33, Index: 16619, Samples: [ Samples: [ 1491, 1506, 1488, 1513, 1488, 1514, 1515, 1518, 1499, 1506, 1543, 1512, 1453, 1508, 1496, 1511, 1499, 1490, 1498, 1502, 1486, 1490, 1514, 1514, 1514, 1493, 1508, 1469, 1504, 1516, 1508, 1566 ], Footer: [ 250, 90 ] } Packet 3 { Ch: 0, Time: 15755341, Logical: 0, Physical: 34, Inde ... [truncated]

Event 269 (62 packets): Packet 0 { Ch: 0, Time: 15745011, Logical: 0, Physical: 55, Index: 16555, Samples: [ Samples: [ 1460, 1529, 1490, 1531, 1526, 1527, 1519, 1525, 1510, 1517, 1532, 1516, 1523, 1484, 1504, 1489, 1518, 1488, 1520, 1495, 1491, 1490, 1538, 1532, 1530, 1519, 1525, 1492, 1496, 1517, 1491, 1539 ], Footer: [ 250, 90 ] } Packet 1 { Ch: 0, Time: 15745011, Logical: 0, Physical: 56, Index: 16556, Samples: [ Samples: [ 1525, 1502, 1456, 1516, 1503, 1512, 1494, 1494, 1500, 1488, 1494, 1511, 1500, 1504, 1483, 1486, 1495, 1521, 1508, 1495, 1510, 1508, 1513, 1472, 1490, 1516, 1500, 1512, 1502, 1513, 1518, 1496 ], Footer: [ 250, 90 ] } Packet 2 { Ch: 0, Time: 15745011, Logical: 0, Physical: 57, Index: 16557, Samples: [ Samples: [ 1516, 1506, 1538, 1534, 1484, 1518, 1520, 1486, 1519, 1519, 1527, 1481, 1494, 1512, 1533, 1516, 1532, 1564, 1536, 1513, 1518, 1516, 1514, 1480, 1520, 1514, 1514, 1455, 1484, 1520, 1496, 1520 ], Footer: [ 250, 90 ] } Packet 3 { Ch: 0, Time: 15745011, Logical: 0, Physical: 58, Inde ... [truncated]


Sample Incorrect Events:
Event 272 (1 packets): Packet 0 { Ch: 0, Time: 15776001, Logical: 0, Physical: 45, Index: 16741, Samples: [ Samples: [ 1543, 1515, 1496, 1526, 1530, 1522, 1512, 1520, 1524, 1525, 1506, 1516, 1497, 1493, 1483, 1488, 1516, 1533, 1519, 1488, 1511, 1487, 1512, 1518, 1516, 1489, 1524, 1467, 1472, 1491, 1480, 1521 ], Footer: [ 250, 90 ] }

Event 136 (1 packets): Packet 0 { Ch: 0, Time: 15776001, Logical: 0, Physical: 45, Index: 8370, Samples: [ Samples: [ 1543, 1515, 1496, 1526, 1530, 1522, 1512, 1520, 1524, 1525, 1506, 1516, 1497, 1493, 1483, 1488, 1516, 1533, 1519, 1488, 1511, 1487, 1512, 1518, 1516, 1489, 1524, 1467, 1472, 1491, 1480, 1521 ], Footer: [ 250, 90 ] }


Total Correct Events: 270 (99.2647%)
Total Incorrect Events: 2 (0.735294%)
--- Standard Event Collection ---
Collected events: 272
Time taken to collect events (standard mode): 0.00371872 seconds
Mode packet count: 62 packets per event
Sample Correct Events:
Event 270 (62 packets): Packet 0 { Ch: 0, Time: 15765671, Logical: 0, Physical: 7, Index: 16679, Samples: [ Samples: [ 1500, 1518, 1519, 1531, 1497, 1516, 1503, 1496, 1514, 1530, 1489, 1514, 1504, 1490, 1494, 1476, 1486, 1516, 1528, 1517, 1488, 1468, 1521, 1516, 1513, 1496, 1540, 1513, 1522, 1517, 1512, 1539 ], Footer: [ 250, 90 ] } Packet 1 { Ch: 0, Time: 15765671, Logical: 0, Physical: 8, Index: 16680, Samples: [ Samples: [ 1528, 1496, 1466, 1516, 1522, 1498, 1486, 1502, 1488, 1504, 1493, 1493, 1512, 1522, 1512, 1516, 1520, 1516, 1505, 1507, 1474, 1507, 1467, 1490, 1464, 1487, 1518, 1534, 1488, 1517, 1568, 1496 ], Footer: [ 250, 90 ] } Packet 2 { Ch: 0, Time: 15765671, Logical: 0, Physical: 9, Index: 16681, Samples: [ Samples: [ 1510, 1480, 1526, 1525, 1484, 1504, 1490, 1506, 1506, 1535, 1544, 1511, 1483, 1507, 1462, 1509, 1518, 1534, 1484, 1490, 1490, 1475, 1496, 1516, 1519, 1540, 1538, 1517, 1502, 1509, 1540, 1566 ], Footer: [ 250, 90 ] } Packet 3 { Ch: 0, Time: 15765671, Logical: 0, Physical: 10, Index: ... [truncated]
Event 269 (62 packets): Packet 0 { Ch: 0, Time: 15755341, Logical: 0, Physical: 31, Index: 16617, Samples: [ Samples: [ 1514, 1498, 1536, 1567, 1483, 1516, 1500, 1494, 1502, 1510, 1531, 1490, 1487, 1488, 1504, 1516, 1517, 1520, 1543, 1535, 1514, 1536, 1506, 1489, 1516, 1518, 1536, 1498, 1526, 1522, 1513, 1538 ], Footer: [ 250, 90 ] } Packet 1 { Ch: 0, Time: 15755341, Logical: 0, Physical: 32, Index: 16618, Samples: [ Samples: [ 1514, 1486, 1476, 1516, 1497, 1494, 1490, 1486, 1513, 1522, 1475, 1489, 1475, 1541, 1490, 1484, 1530, 1542, 1518, 1490, 1513, 1517, 1500, 1495, 1538, 1513, 1488, 1514, 1502, 1516, 1542, 1538 ], Footer: [ 250, 90 ] } Packet 2 { Ch: 0, Time: 15755341, Logical: 0, Physical: 33, Index: 16619, Samples: [ Samples: [ 1491, 1506, 1488, 1513, 1488, 1514, 1515, 1518, 1499, 1506, 1543, 1512, 1453, 1508, 1496, 1511, 1499, 1490, 1498, 1502, 1486, 1490, 1514, 1514, 1514, 1493, 1508, 1469, 1504, 1516, 1508, 1566 ], Footer: [ 250, 90 ] } Packet 3 { Ch: 0, Time: 15755341, Logical: 0, Physical: 34, Inde ... [truncated]
Event 268 (62 packets): Packet 0 { Ch: 0, Time: 15745011, Logical: 0, Physical: 55, Index: 16555, Samples: [ Samples: [ 1460, 1529, 1490, 1531, 1526, 1527, 1519, 1525, 1510, 1517, 1532, 1516, 1523, 1484, 1504, 1489, 1518, 1488, 1520, 1495, 1491, 1490, 1538, 1532, 1530, 1519, 1525, 1492, 1496, 1517, 1491, 1539 ], Footer: [ 250, 90 ] } Packet 1 { Ch: 0, Time: 15745011, Logical: 0, Physical: 56, Index: 16556, Samples: [ Samples: [ 1525, 1502, 1456, 1516, 1503, 1512, 1494, 1494, 1500, 1488, 1494, 1511, 1500, 1504, 1483, 1486, 1495, 1521, 1508, 1495, 1510, 1508, 1513, 1472, 1490, 1516, 1500, 1512, 1502, 1513, 1518, 1496 ], Footer: [ 250, 90 ] } Packet 2 { Ch: 0, Time: 15745011, Logical: 0, Physical: 57, Index: 16557, Samples: [ Samples: [ 1516, 1506, 1538, 1534, 1484, 1518, 1520, 1486, 1519, 1519, 1527, 1481, 1494, 1512, 1533, 1516, 1532, 1564, 1536, 1513, 1518, 1516, 1514, 1480, 1520, 1514, 1514, 1455, 1484, 1520, 1496, 1520 ], Footer: [ 250, 90 ] } Packet 3 { Ch: 0, Time: 15745011, Logical: 0, Physical: 58, Inde ... [truncated]
Sample Incorrect Events:
Event 271 (1 packets): Packet 0 { Ch: 0, Time: 15776001, Logical: 0, Physical: 45, Index: 16741, Samples: [ Samples: [ 1543, 1515, 1496, 1526, 1530, 1522, 1512, 1520, 1524, 1525, 1506, 1516, 1497, 1493, 1483, 1488, 1516, 1533, 1519, 1488, 1511, 1487, 1512, 1518, 1516, 1489, 1524, 1467, 1472, 1491, 1480, 1521 ], Footer: [ 250, 90 ] }
Event 135 (1 packets): Packet 0 { Ch: 0, Time: 15776001, Logical: 0, Physical: 45, Index: 8370, Samples: [ Samples: [ 1543, 1515, 1496, 1526, 1530, 1522, 1512, 1520, 1524, 1525, 1506, 1516, 1497, 1493, 1483, 1488, 1516, 1533, 1519, 1488, 1511, 1487, 1512, 1518, 1516, 1489, 1524, 1467, 1472, 1491, 1480, 1521 ], Footer: [ 250, 90 ] }
Total Correct Events: 270 (99.2647%)
Total Incorrect Events: 2 (0.735294%)
--- Lazy Mode Event Collection ---
Collected events: 272
Time taken to collect events (lazy mode): 0.00137712 seconds
Mode packet count: 62 packets per event
Sample Correct Events:
Event 271 (62 packets): Packet 0 { Ch: 0, Time: 15765671, Logical: 0, Physical: 7, Index: 16679, Samples: [ Samples: [ 1500, 1518, 1519, 1531, 1497, 1516, 1503, 1496, 1514, 1530, 1489, 1514, 1504, 1490, 1494, 1476, 1486, 1516, 1528, 1517, 1488, 1468, 1521, 1516, 1513, 1496, 1540, 1513, 1522, 1517, 1512, 1539 ], Footer: [ 250, 90 ] } Packet 1 { Ch: 0, Time: 15765671, Logical: 0, Physical: 8, Index: 16680, Samples: [ Samples: [ 1528, 1496, 1466, 1516, 1522, 1498, 1486, 1502, 1488, 1504, 1493, 1493, 1512, 1522, 1512, 1516, 1520, 1516, 1505, 1507, 1474, 1507, 1467, 1490, 1464, 1487, 1518, 1534, 1488, 1517, 1568, 1496 ], Footer: [ 250, 90 ] } Packet 2 { Ch: 0, Time: 15765671, Logical: 0, Physical: 9, Index: 16681, Samples: [ Samples: [ 1510, 1480, 1526, 1525, 1484, 1504, 1490, 1506, 1506, 1535, 1544, 1511, 1483, 1507, 1462, 1509, 1518, 1534, 1484, 1490, 1490, 1475, 1496, 1516, 1519, 1540, 1538, 1517, 1502, 1509, 1540, 1566 ], Footer: [ 250, 90 ] } Packet 3 { Ch: 0, Time: 15765671, Logical: 0, Physical: 10, Index: ... [truncated]
Event 270 (62 packets): Packet 0 { Ch: 0, Time: 15755341, Logical: 0, Physical: 31, Index: 16617, Samples: [ Samples: [ 1514, 1498, 1536, 1567, 1483, 1516, 1500, 1494, 1502, 1510, 1531, 1490, 1487, 1488, 1504, 1516, 1517, 1520, 1543, 1535, 1514, 1536, 1506, 1489, 1516, 1518, 1536, 1498, 1526, 1522, 1513, 1538 ], Footer: [ 250, 90 ] } Packet 1 { Ch: 0, Time: 15755341, Logical: 0, Physical: 32, Index: 16618, Samples: [ Samples: [ 1514, 1486, 1476, 1516, 1497, 1494, 1490, 1486, 1513, 1522, 1475, 1489, 1475, 1541, 1490, 1484, 1530, 1542, 1518, 1490, 1513, 1517, 1500, 1495, 1538, 1513, 1488, 1514, 1502, 1516, 1542, 1538 ], Footer: [ 250, 90 ] } Packet 2 { Ch: 0, Time: 15755341, Logical: 0, Physical: 33, Index: 16619, Samples: [ Samples: [ 1491, 1506, 1488, 1513, 1488, 1514, 1515, 1518, 1499, 1506, 1543, 1512, 1453, 1508, 1496, 1511, 1499, 1490, 1498, 1502, 1486, 1490, 1514, 1514, 1514, 1493, 1508, 1469, 1504, 1516, 1508, 1566 ], Footer: [ 250, 90 ] } Packet 3 { Ch: 0, Time: 15755341, Logical: 0, Physical: 34, Inde ... [truncated]
Event 269 (62 packets): Packet 0 { Ch: 0, Time: 15745011, Logical: 0, Physical: 55, Index: 16555, Samples: [ Samples: [ 1460, 1529, 1490, 1531, 1526, 1527, 1519, 1525, 1510, 1517, 1532, 1516, 1523, 1484, 1504, 1489, 1518, 1488, 1520, 1495, 1491, 1490, 1538, 1532, 1530, 1519, 1525, 1492, 1496, 1517, 1491, 1539 ], Footer: [ 250, 90 ] } Packet 1 { Ch: 0, Time: 15745011, Logical: 0, Physical: 56, Index: 16556, Samples: [ Samples: [ 1525, 1502, 1456, 1516, 1503, 1512, 1494, 1494, 1500, 1488, 1494, 1511, 1500, 1504, 1483, 1486, 1495, 1521, 1508, 1495, 1510, 1508, 1513, 1472, 1490, 1516, 1500, 1512, 1502, 1513, 1518, 1496 ], Footer: [ 250, 90 ] } Packet 2 { Ch: 0, Time: 15745011, Logical: 0, Physical: 57, Index: 16557, Samples: [ Samples: [ 1516, 1506, 1538, 1534, 1484, 1518, 1520, 1486, 1519, 1519, 1527, 1481, 1494, 1512, 1533, 1516, 1532, 1564, 1536, 1513, 1518, 1516, 1514, 1480, 1520, 1514, 1514, 1455, 1484, 1520, 1496, 1520 ], Footer: [ 250, 90 ] } Packet 3 { Ch: 0, Time: 15745011, Logical: 0, Physical: 58, Inde ... [truncated]
Sample Incorrect Events:
Event 272 (1 packets): Packet 0 { Ch: 0, Time: 15776001, Logical: 0, Physical: 45, Index: 16741, Samples: [ Samples: [ 1543, 1515, 1496, 1526, 1530, 1522, 1512, 1520, 1524, 1525, 1506, 1516, 1497, 1493, 1483, 1488, 1516, 1533, 1519, 1488, 1511, 1487, 1512, 1518, 1516, 1489, 1524, 1467, 1472, 1491, 1480, 1521 ], Footer: [ 250, 90 ] }
Event 136 (1 packets): Packet 0 { Ch: 0, Time: 15776001, Logical: 0, Physical: 45, Index: 8370, Samples: [ Samples: [ 1543, 1515, 1496, 1526, 1530, 1522, 1512, 1520, 1524, 1525, 1506, 1516, 1497, 1493, 1483, 1488, 1516, 1533, 1519, 1488, 1511, 1487, 1512, 1518, 1516, 1489, 1524, 1467, 1472, 1491, 1480, 1521 ], Footer: [ 250, 90 ] }
Total Correct Events: 270 (99.2647%)
Total Incorrect Events: 2 (0.735294%)17/02/2025 20:51
I'm realizing the timestamp difference between events depends on number of windows and number of channels. This is making me think I left the trigger rate at a saturated value:
Time diff between 1 channel, 62 windows == ~ 10,000
Time diff between 1 channel, 1 windows == ~ 1,000
Time diff between 32 channel, 31 windows == ~40,000
Time diff between 32 channel, 62 windows == ~ 80,000
18/02/2025 20:31
I was right, the trigger rate was at ~28kHz. I turned it down to 1kHz, but even this saturates the data rate once there's too many windows or channels:
Processing file: captured_events_w62_ch1_1kHz.bin
Sample Positive Time Differences from captured_events_w62_ch1_1kHz.bin: [23843, 23844, 23844, 23842, 23844]
Sample Negative Time Differences from captured_events_w62_ch1_1kHz.bin: [-1120635, -1144479, -1144479, -1144479]
========================================
Processing file: captured_events_w62_ch32_1kHz.bin
Sample Positive Time Differences from captured_events_w62_ch32_1kHz.bin: [95373, 95374, 95372, 95375, 95372]
Sample Negative Time Differences from captured_events_w62_ch32_1kHz.bin: []
========================================
Processing file: captured_events_w31_ch32_1kHz.bin
Sample Positive Time Differences from captured_events_w31_ch32_1kHz.bin: [47688, 47686, 47686, 47686, 47688]
Sample Negative Time Differences from captured_events_w31_ch32_1kHz.bin: []
========================================
Processing file: captured_events_w31_ch1_1kHz.bin
Sample Positive Time Differences from captured_events_w31_ch1_1kHz.bin: [23844, 23843, 23843, 23844, 23842]
Sample Negative Time Differences from captured_events_w31_ch1_1kHz.bin: [-1192172, -1192172, -1192172, -1192172, -1192172]
========================================
Processing file: captured_events_w1_ch32_1kHz.bin
Sample Positive Time Differences from captured_events_w1_ch32_1kHz.bin: [23843, 23844, 23842, 23845, 23844]
Sample Negative Time Differences from captured_events_w1_ch32_1kHz.bin: [-1096796, -1096796, -1096796, -1096796, -1096796]
========================================
Processing file: captured_events_w1_ch1_1kHz.bin
Sample Positive Time Differences from captured_events_w1_ch1_1kHz.bin: [23844, 23842, 23844, 23843, 23843]
Sample Negative Time Differences from captured_events_w1_ch1_1kHz.bin: [-929890, -929890, -929890, -929890, -929890]
20/02/2025 20:35
I discovered the origin of the b"\x04\x00\x00\x00\x00\x00\x00\x00\x00\x00\x00\x00\x00\x00\x00\x00" "error code". It seems to be a UDP packet header. UDP payloads from the board come in 1040 byte chunks, the first 16 bytes are this header. So really they're 1024 byte payloads, which makes more sense.
captured_events_w62_ch1_1kHz.bin: 1084 occurrences, expected ~1084.00 (size / 1040)
Occurrences found at: [0, 1040, 2080, 3120, 4160, '...', 1122160, 1123200, 1124240, 1125280, 1126320]

captured_events_w62_ch32_1kHz.bin: 1000 occurrences, expected ~1000.00 (size / 1040)
Occurrences found at: [0, 1040, 2080, 3120, 4160, '...', 1034800, 1035840, 1036880, 1037920, 1038960]

captured_events_w62_ch32_28kHz.bin: 1000 occurrences, expected ~1000.00 (size / 1040)
Occurrences found at: [0, 1040, 2080, 3120, 4160, '...', 1034800, 1035840, 1036880, 1037920, 1038960]

captured_events_w62_ch1_28kHz.bin: 1210 occurrences, expected ~1210.00 (size / 1040)
Occurrences found at: [0, 1040, 2080, 3120, 4160, '...', 1253200, 1254240, 1255280, 1256320, 1257360]

captured_events_w31_ch32_1kHz.bin: 1000 occurrences, expected ~1000.00 (size / 1040)
Occurrences found at: [0, 1040, 2080, 3120, 4160, '...', 1034800, 1035840, 1036880, 1037920, 1038960]

captured_events_w31_ch32_28kHz.bin: 1000 occurrences, expected ~1000.00 (size / 1040)
Occurrences found at: [0, 1040, 2080, 3120, 4160, '...', 1034800, 1035840, 1036880, 1037920, 1038960]

captured_events_w31_ch1_1kHz.bin: 1024 occurrences, expected ~1024.00 (size / 1040)
Occurrences found at: [0, 1040, 2080, 3120, 4160, '...', 1059760, 1060800, 1061840, 1062880, 1063920]

captured_events_w1_ch1_28kHz.bin: 1028 occurrences, expected ~1028.00 (size / 1040)
Occurrences found at: [0, 1040, 2080, 3120, 4160, '...', 1063920, 1064960, 1066000, 1067040, 1068080]

captured_events_w1_ch32_1kHz.bin: 1080 occurrences, expected ~1080.00 (size / 1040)
Occurrences found at: [0, 1040, 2080, 3120, 4160, '...', 1118000, 1119040, 1120080, 1121120, 1122160]

captured_events_w1_ch1_1kHz.bin: 0 occurrences, expected ~1002.00 (size / 1040)
Occurrences found at: []
For some reason, they don't occur in the "captured_events_w1_ch1_1kHz.bin" case. At first I thought maybe the header has information of how many bytes are in this "event", but that doesn't make sense.
20/02/2025 20:49
"captured_events_w1_ch1_1kHz.bin" appears to have more headers. I've highlighted them here:
01720000 00000000 00000000 00000000 0e000c27 01fb002f 05a705bd 05d105ef 05d005d2 05d705ad 05b905d8 05d505be 05bd05ae 05b705be 05b205d9 05d005b0 05ea05bb 05d205c5 05d405d6 05d905b3 05bc05a6 05a805d1 fa5a0e00 0c2c0f1f 001505de 05c505c6 05ed05a6 05b505b7 05b805ba 05db05e0 05d105b4 05de05e2 05d405c1 05e205de 05fd05c2 05bc05c4 05d605be 05d605d0 05c605b6 05c705b4 05d3fa5a 0e000c32 0c410037 059e05e8 05c305e8 05e005e6 05de05e0 05d005d8 05e705d4 05dd05b6 05d005ba 05da05ba 05de05cd 05c205be 05ed05e7 05e705da 05e405c4 05c605d5 05c405ee fa5a0e00 0c380965 001d05d4 05e205d8 05e905be 05d005d2 05bc05cb 05ce05c4 05b805b7 05b805c2 05d505b6 05dd05d4 05c005d0 05cc05d8 05eb05e0 05a205c2 05b205d3 05c905cf 0611fa5a 0e000c3e 06880002 05e905cb 05a005bc 05cc05c0 05d605bb 05b805c9 05d005ce 05f005f0 05e005d1 05b805ec 05d305d1 05bd05d2 05c805ed 05d405d2 05d505bf 05d405d2 05ee05fa fa5a0206 00000000 00000000 00000000 00000e00 0c4403ab 002505c4 05b805e6 05d305c7 05d305e4 05e005d2 05dd05e0 05a305d1 05ce05c3 05be05bd 05b605ac 05c505bd 05b405bf 05bc05dc 05d305d3 05b605b8 05b605a2 05ecfa5a 0e000c4a 00ce000a 05e205b2 05d005d0 05d505d0 05d405e1 05ed05bc 05ce05ba 05ee05ea 05a205a0 05ba05da 05de05cb 05b105d2 05a405c2 05bb05d8 05d205d0 05c705d2 05d605d3 fa5a0e00 0c4f0df1 002d05ee 05d405c6 05e205e7 05de05d2 05d905df 05dc05c9 05d405c6 05c005b2 05b805d2 05e705d9 05bc05d2 05b905d2 05d605d6 05bb05e1 05a405ab 05be05b2 05dcfa5a 0e000c55 0b150013 05cd05d0 05d205fb 05b905c0 05b405c6 05b605d9 05d805bc 05b705cf 05dc05cf 05d105bc 05b605c8 05d005d0 05d805dc 05b405d6 05c805a3 05b505ce 05c205f6 fa5a0e00 0c5b083b 003905d5 05d005ec 05ec05b8 05da05dc 05b805d8 05da05df 05b205c1 05d005e5 05d305e5 060605ec 05d205d8 05d605d5 05b405dc 05d505d5 059e05b6 05d805c4 05d9fa5a 0e000c61 055e001e 05ee05bd 05c405e5 05eb05c0 05a205b9 05d005c5 05b805ca 05d305ec 05b805ba 05ce05ed 05ea05e4 05d40602 05c705d4 05d405d3 05d105d0 05cf05c2 05ed05e5 fa5a0e00 0c670281 000305b6 05b605dc 05fe05d7 05df05e6 05bb05cc 05b905ed 05e105d6 05d605d5 05e605b3 05d705d6 05ba05be 05d205d5 05e705d4 05e805b4 05b805d6 05d105d1 0606fa5a 02060000 00000000 00000000 00000000 0e000c6c 0fa40026 05f105b7 05bf05ca 05cf05e6 05d305c8 05cd05d6 05c105d0 05c405d8 05af05c2 05c505c6 05cf05d3 05d005df 05c705c9 05d005ed 05ec05d6 05d605e5 060005f0 fa5a0e00 0c720cc7 000b05d2 05d205c8 05e505c6 05dc05c4 05ca05c0 05ec05e1
If you convert 0x0206 to decimal, you get 518, which is exactly how many bytes are before the next header. Similarly you can do the same for 0x0172 to 370 in decimal. This makes sense because 0x0400 is 1024 in hex, which is the largest UDP packet the board will send.
Sample Incorrect Events:
Event 22962 (25 packets): Packet 0 { Ch: 0, Time: 843213, Logical: 0, Physical: 3, Index: 1423528, Samples: [ Samples: [ 1472, 1470, 1517, 1544, 1510, 1517, 1520, 1482, 1495, 1483, 1532, 1519, 1511, 1506, 1509, 1522, 1472, 1514, 1513, 1480, 1485, 1495, 1510, 1525, 1506, 1522, 1470, 1478, 1515, 1503, 1493, 1550 ], Footer: [ 250, 90 ] } Packet 1 { Ch: 0, Time: 843213, Logical: 0, Physical: 4, Index: 1423529, Samples: [ Samples: [ 1537, 1480, 1438, 1512, 1519, 1502, 1517, 1510, 1526, 1490, 1486, 1488, 1498, 1480, 1469, 1515, 1488, 1519, 1515, 1508, 1522, 1516, 1493, 1513, 1466, 1511, 1523, 1530, 1492, 1518, 1534, 1525 ], Footer: [ 250, 90 ] } Packet 2 { Ch: 0, Time: 843213, Logical: 0, Physical: 5, Index: 1423530, Samples: [ Samples: [ 1512, 1496, 1458, 1519, 1499, 1496, 1504, 1503, 1456, 1516, 1524, 1514, 1493, 1459, 1513, 1500, 1497, 1501, 1512, 1520, 1515, 1493, 1517, 1501, 1507, 1510, 1493, 1465, 1468, 1489, 1492, 1516 ], Footer: [ 250, 90 ] } Packet 3 { Ch: 0, Time: 843213, Logical: 0, Physical: 6, Index: 142 ... [truncated]

Event 1 (8 packets): Packet 0 { Ch: 0, Time: 6961400, Logical: 0, Physical: 52, Index: 0, Samples: [ Samples: [ 1535, 1470, 1486, 1536, 1528, 1504, 1518, 1498, 1520, 1516, 1516, 1498, 1518, 1516, 1495, 1471, 1514, 1537, 1495, 1470, 1521, 1526, 1488, 1492, 1506, 1519, 1495, 1522, 1489, 1540, 1526, 1528 ], Footer: [ 250, 90 ] } Packet 1 { Ch: 0, Time: 6961400, Logical: 0, Physical: 53, Index: 1, Samples: [ Samples: [ 1496, 1506, 1476, 1540, 1493, 1503, 1463, 1464, 1521, 1528, 1510, 1490, 1496, 1499, 1506, 1469, 1470, 1496, 1512, 1516, 1516, 1500, 1508, 1489, 1492, 1500, 1497, 1493, 1472, 1507, 1519, 1515 ], Footer: [ 250, 90 ] } Packet 2 { Ch: 0, Time: 6961400, Logical: 0, Physical: 54, Index: 2, Samples: [ Samples: [ 1541, 1438, 1470, 1512, 1490, 1506, 1496, 1482, 1502, 1514, 1496, 1516, 1491, 1504, 1476, 1484, 1504, 1521, 1480, 1486, 1478, 1491, 1480, 1492, 1487, 1498, 1500, 1515, 1500, 1513, 1485, 1492 ], Footer: [ 250, 90 ] } Packet 3 { Ch: 0, Time: 6961400, Logical: 0, Physical: 55, Index: 3, Samples: [ ... [truncated]


Total Correct Events: 22960 (99.9913%)
Total Incorrect Events: 2 (0.00871004%)
Sample Incorrect Events:
Event 22962 (25 packets): Packet 0 { Ch: 0, Time: 843213, Logical: 0, Physical: 3, Index: 1423528, Samples: [ Samples: [ 1472, 1470, 1517, 1544, 1510, 1517, 1520, 1482, 1495, 1483, 1532, 1519, 1511, 1506, 1509, 1522, 1472, 1514, 1513, 1480, 1485, 1495, 1510, 1525, 1506, 1522, 1470, 1478, 1515, 1503, 1493, 1550 ], Footer: [ 250, 90 ] } Packet 1 { Ch: 0, Time: 843213, Logical: 0, Physical: 4, Index: 1423529, Samples: [ Samples: [ 1537, 1480, 1438, 1512, 1519, 1502, 1517, 1510, 1526, 1490, 1486, 1488, 1498, 1480, 1469, 1515, 1488, 1519, 1515, 1508, 1522, 1516, 1493, 1513, 1466, 1511, 1523, 1530, 1492, 1518, 1534, 1525 ], Footer: [ 250, 90 ] } Packet 2 { Ch: 0, Time: 843213, Logical: 0, Physical: 5, Index: 1423530, Samples: [ Samples: [ 1512, 1496, 1458, 1519, 1499, 1496, 1504, 1503, 1456, 1516, 1524, 1514, 1493, 1459, 1513, 1500, 1497, 1501, 1512, 1520, 1515, 1493, 1517, 1501, 1507, 1510, 1493, 1465, 1468, 1489, 1492, 1516 ], Footer: [ 250, 90 ] } Packet 3 { Ch: 0, Time: 843213, Logical: 0, Physical: 6, Index: 142 ... [truncated]
Event 1 (8 packets): Packet 0 { Ch: 0, Time: 6961400, Logical: 0, Physical: 52, Index: 0, Samples: [ Samples: [ 1535, 1470, 1486, 1536, 1528, 1504, 1518, 1498, 1520, 1516, 1516, 1498, 1518, 1516, 1495, 1471, 1514, 1537, 1495, 1470, 1521, 1526, 1488, 1492, 1506, 1519, 1495, 1522, 1489, 1540, 1526, 1528 ], Footer: [ 250, 90 ] } Packet 1 { Ch: 0, Time: 6961400, Logical: 0, Physical: 53, Index: 1, Samples: [ Samples: [ 1496, 1506, 1476, 1540, 1493, 1503, 1463, 1464, 1521, 1528, 1510, 1490, 1496, 1499, 1506, 1469, 1470, 1496, 1512, 1516, 1516, 1500, 1508, 1489, 1492, 1500, 1497, 1493, 1472, 1507, 1519, 1515 ], Footer: [ 250, 90 ] } Packet 2 { Ch: 0, Time: 6961400, Logical: 0, Physical: 54, Index: 2, Samples: [ Samples: [ 1541, 1438, 1470, 1512, 1490, 1506, 1496, 1482, 1502, 1514, 1496, 1516, 1491, 1504, 1476, 1484, 1504, 1521, 1480, 1486, 1478, 1491, 1480, 1492, 1487, 1498, 1500, 1515, 1500, 1513, 1485, 1492 ], Footer: [ 250, 90 ] } Packet 3 { Ch: 0, Time: 6961400, Logical: 0, Physical: 55, Index: 3, Samples: [ ... [truncated]
Total Correct Events: 22960 (99.9913%)
Total Incorrect Events: 2 (0.00871004%)